Welcome to The Griffin Real Estate Market Update.
If you’re thinking about buying or selling residential real estate, it’s important to understand the current market trends.
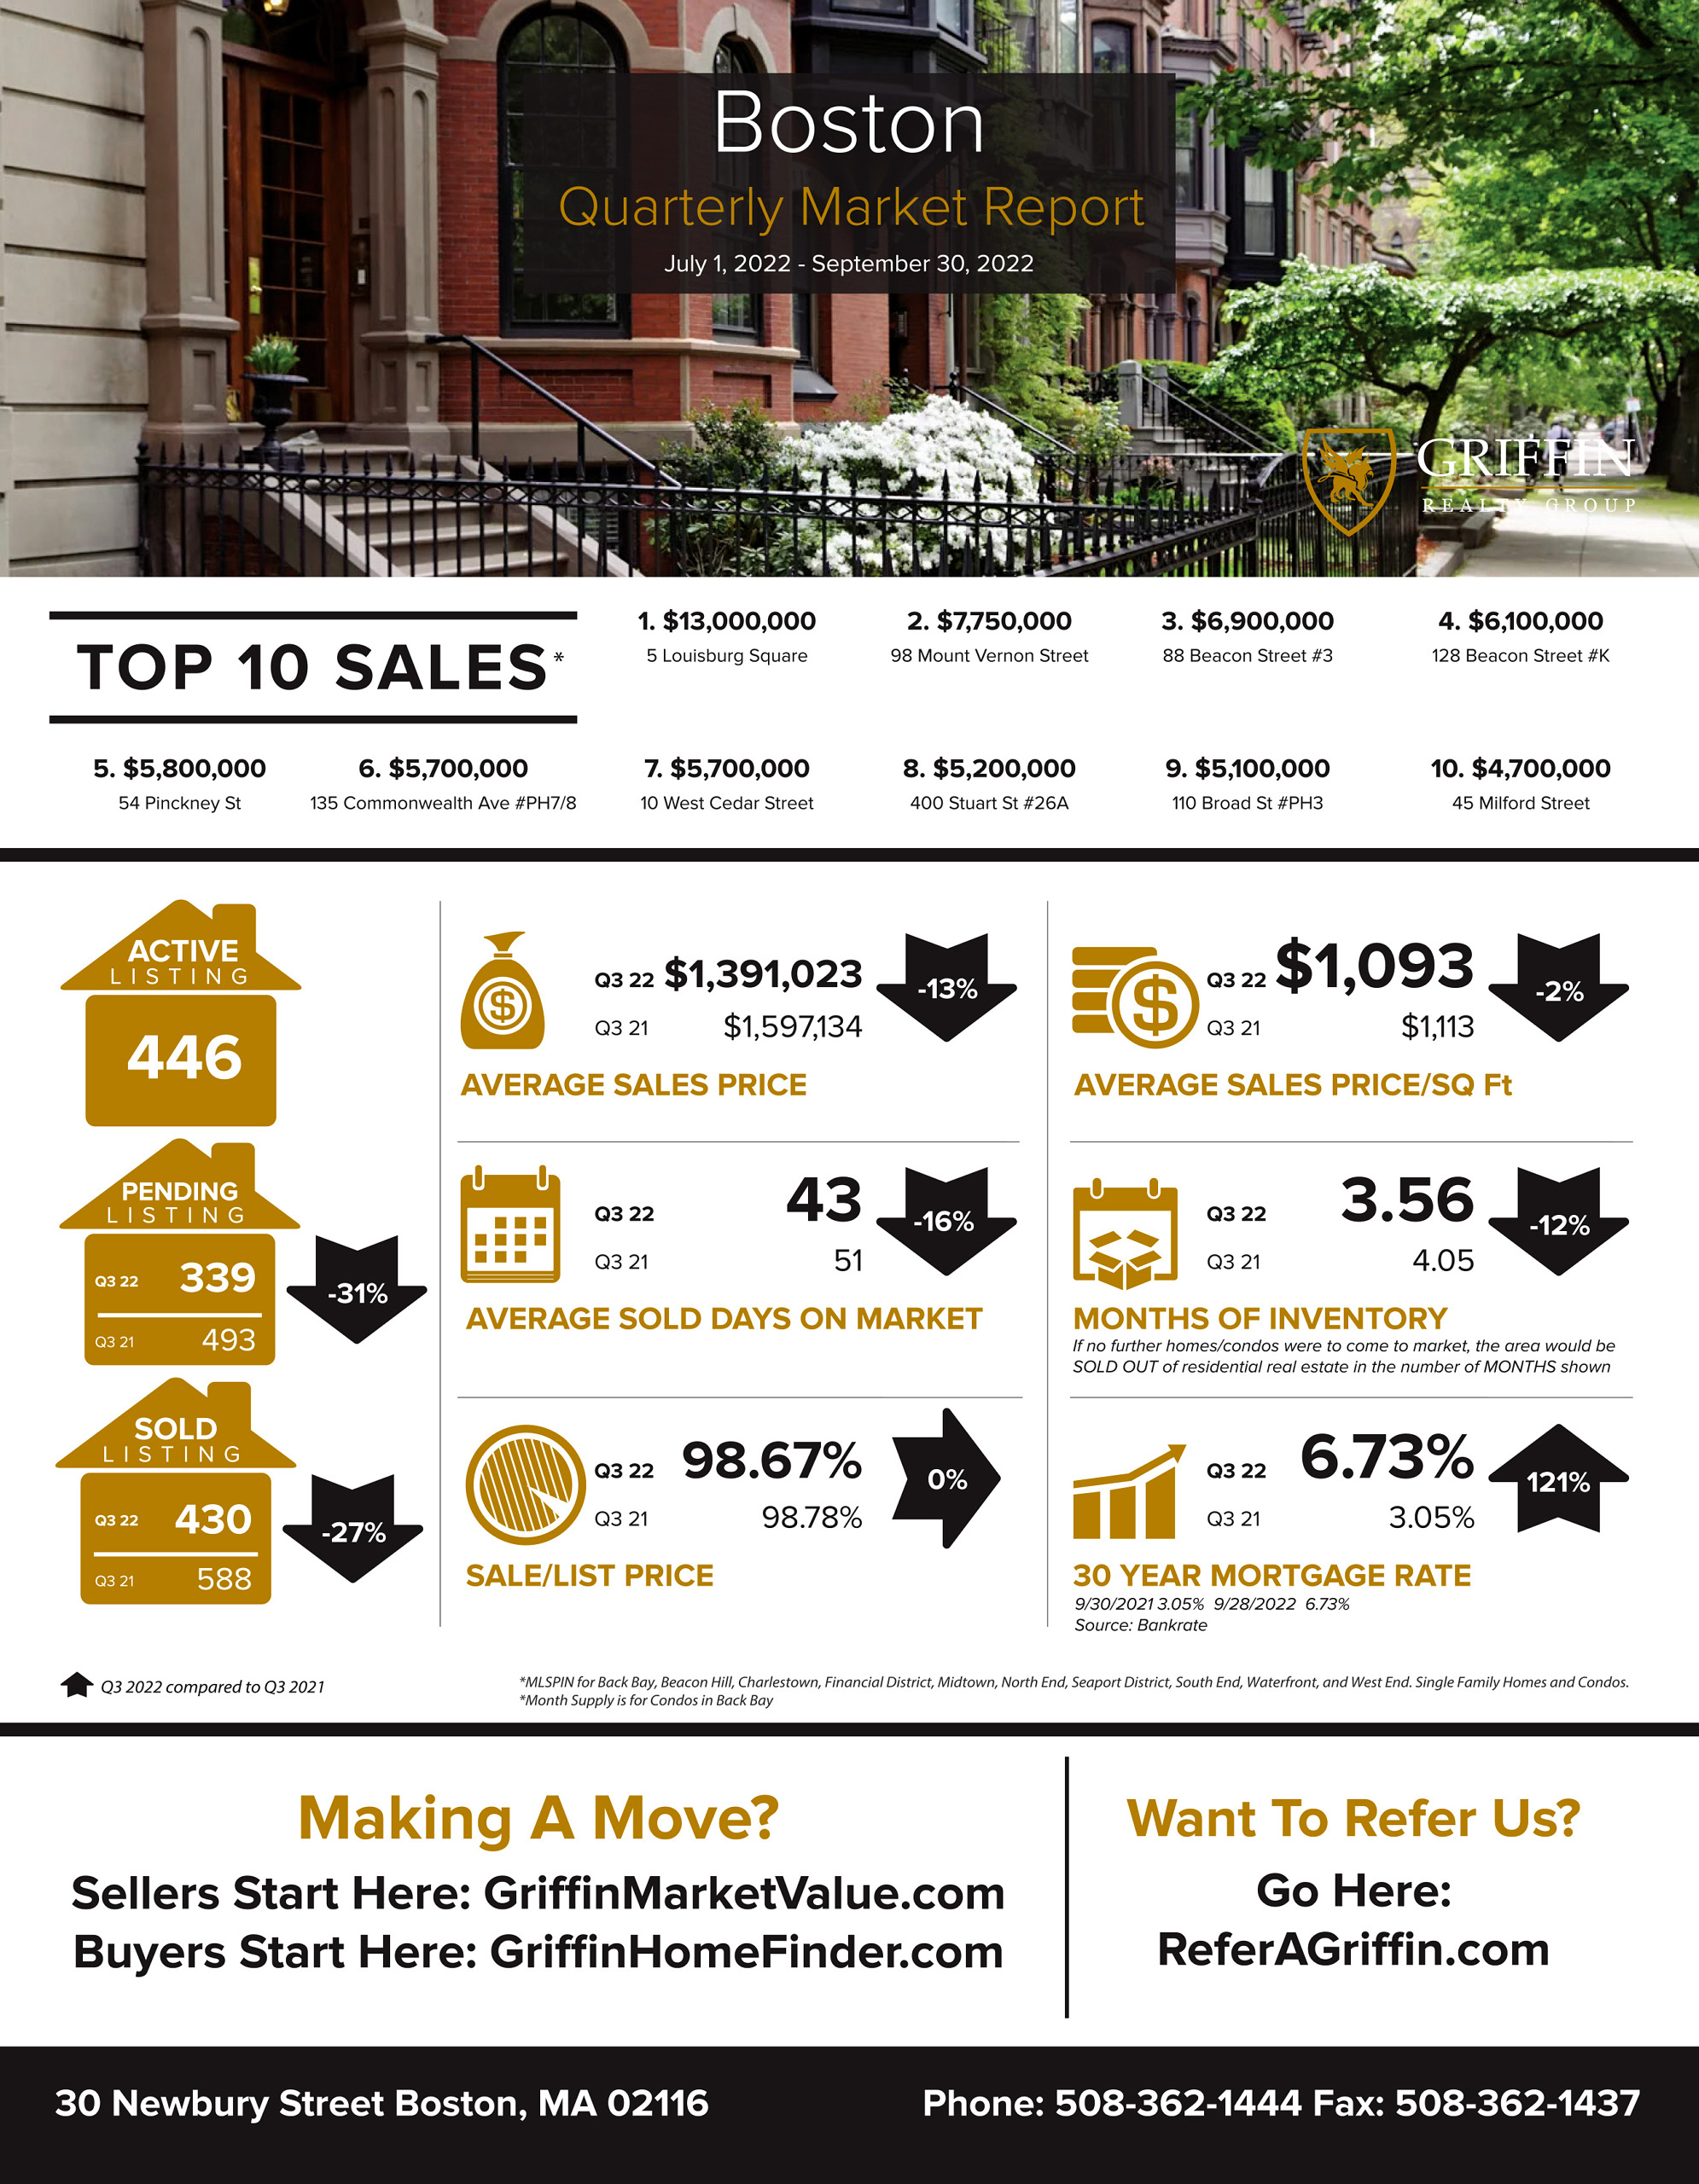
According to MLSPIN, the marketplace for Boston residential properties, here’s what happened in Q3 2022 versus Q3 2021:
The Number of SOLD listings decreased by 27% to 430 properties with a top sale of $13 million at 5 Louisburg Square in Boston.
The Average Sales Price decreased by 13% to $1.39 million moving the Average Price Per Square Foot down to $1093 per square foot.
The inventory of properties available for sale as measured in months supply decreased by 12% to 3.56 months worth of properties for sale.
The average 30 year fixed mortgage rate increased to 3.05% according to Bank Rate.com.
Thanks for tuning in, we’ll see you in the next Griffin Real Estate Market Update.
Boston
Average Sales Price
Q3 2021 – $1597134.28
Q3 2022 – $1391022.5
decreased by 13%
Average Days On Market
Q3 2021 – 51
Q3 2022 – 43
decreased by 16%
Average Sale Price Per Square Foot
Q3 2021 – $1112.81
Q3 2022 – $1092.68
decreased by 2%
Sale to List Price Ratio
Q3 2021 – 98.78%
Q3 2022 – 98.67%
had no change with
Number of Sold Listings
Q3 2021 – 588
Q3 2022 – 430
decreased by 27%
Months Supply of Inventory
Q3 2021 – 4.05
Q3 2022 – 3.56
decreased by 12%
Mortgage Rate
Q3 2021 – 6.73%
Q3 2022 – 3.05%
121% increased
Top 10 Sales
- $13000000 5 Louisburg Square Boston, MA
- $7750000 98 Mount Vernon Street Boston, MA
- $6900000 88 Beacon Street #3 Boston, MA
- $6100000 128 Beacon Street #K Boston, MA
- $5800000 54 Pinckney St Boston, MA
- $5700000 135 Commonwealth Ave #PH7/8 Boston, MA
- $5700000 10 West Cedar Street Boston, MA
- $5200000 400 Stuart St #26A Boston, MA
- $5100000 110 Broad St #PH3 Boston, MA
- $4700000 45 Milford Street Boston, MA
GRAB OUR FREE COURSES 6 Steps To Home Buyer Success – http://griffinbuyercourse.com 7 Steps To Home Seller Plan – http://griffinsellercourse.com 8 Steps To Agent Success – http://griffinagentcourse.com